

Are Declining Total Births Really a Disaster for a Country – The Japan Scenario
To state the obvious, the number of births each year determines the number of children, the size of the working-age population 15 to 20 years later (depending on the availability of education), and ultimately the size of the ageing population some 70 years later.
Given the significant impact of changes in the number of births per annum over time, particularly in older and more affluent countries, examining the long-term effects of declining total births is crucial. This paper aims to do just that, using Japan as an example.
So first, what is the medium-term history of the birth rate in Japan?
This is shown in Figure 1. The measure here is the number of live births per thousand women aged between 15 and 49. This is a reliable measure as the Government measures both variables systematically. It also has the advantage of being current rather than ’Total Fertility’ measures (the total number of children the average woman has by age 49), which effectively look back 35 years and is outdated regarding current attitudes to having children.
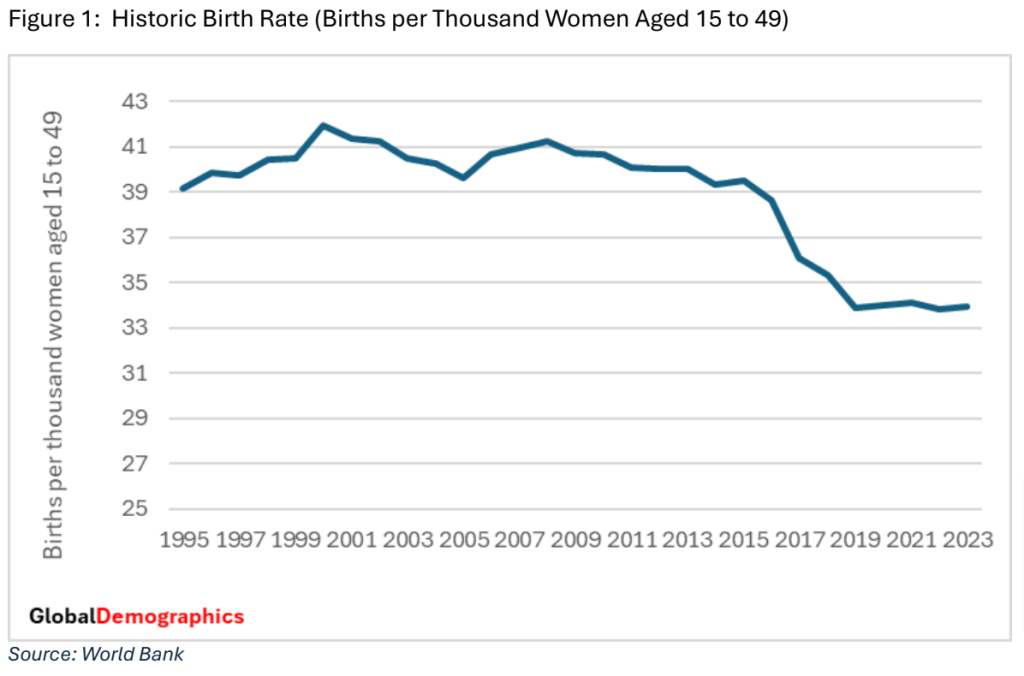
This is quite a long-term picture, from 1995 to 2023 (18 years). The trend was relatively stable until 2015 when it started to decrease. One reason is that an increasing proportion of women aged 15 to 49 were over 34– for whom the propensity to have a child is significantly lower. That age group reached 50% in 2018. However, the trend in the size of all age groups was downward, such that the average birth rate was 35.3 by 2018. During COVID-19 (2019 to 2021), it stabilized at 34 births per thousand women aged 15 to 49 and remained at that level for 2022 and 2023.
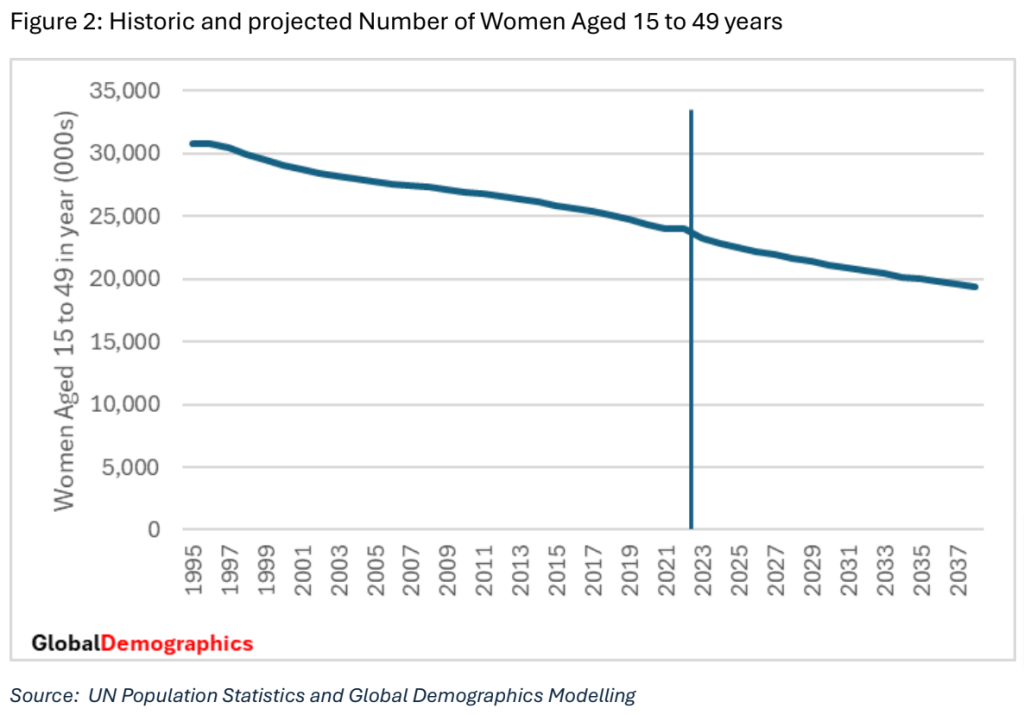
The other key variable determining the number of births yearly is the number of women aged 15 to 49. The history of that variable is shown in Figure 2. It is also projected forward to 2038 as the number can be accurately determined to that year. Those women aged 15 to 49 in 2038 are already alive (albeit aged 0 to 15 in 2023).
As demonstrated in Figure 2, the number has been declining steadily, and this will continue until 2038, irrespective of the birth rate in the next ten years (2013 to 2023). It dropped from 26.4 million in 2003 to 23.2 million by 2023 and will decline to 19.46 million by 2038. The only factor that would change this scenario is aggressive immigration in the next decade. This is important as this variable is a more significant determinant of the reduction in the number of births in the next decade than the birth rate itself.
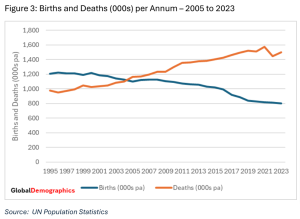
The obvious outcome from the previous two charts is that total births declined. That is shown in Figure 3. In 1995, there were 1.2 million births. This dropped to 1.1 million by 2005 –relatively stable for that period. However, after 2005, the decline steepened; by 2015, total births were 1.021 million. This decline then increased such that by 2018 (pre-Covid), it was at 885 million, and the latest actual for 2023 is 788 thousand births. So, in the past 28 years, total births per annum have declined by 419 thousand. That is a significant change.
As mentioned, there was a more rapid decline from 2016 to 2019, perhaps due to the tighter economic scenario over those years and the ‘ageing’ of the relevant female population—with 50% over 34 years of age.
In the past 28 years, total births per annum have declined by 419 thousand.
Japan’s propensity and ability (in terms of sufficient couples of family-forming age) to have more children has declined significantly over the last two decades, particularly since 2015.
Finally, in this preamble, it is helpful to show the trend in deaths, as that offset against births shows the impact of changes on the total population historically. The inflexion point was 2004 – the year when deaths exceeded births, and given that Japan has minimal immigration, it is also the point at which the total population ceased growing. As discussed subsequently, with the growing number of persons aged over 74 years until 2032, this disparity will continue to increase.
What about the future implications of this reality?
Of course, the first issue to address is the likely birth rate for future years. Can it be increased sufficiently to offset the population decline? Given that Japan has 1.4 million deaths per annum—peaking at 1.7 million by 2043—the birth rate would have to increase significantly to offset that.
Given that the number of women of childbearing age and the likely deaths are known with some certainty through 2038, we can calculate the required level for those years quite reliably. The numbers indicate that the birth rate would have to increase to 76 by 2038 from a known 38 per thousand in 2024. That is a 100 % increase, which is considerable.
The probability of that happening is extremely low. Many examples (Singapore and South Korea, for example) of governments that have attempted to increase the birth rate through financial and social incentives without success.
Furthermore, social factors indicate it is unlikely. There are only three countries in the world (of the 118 covered by Global Demographics Ltd) where the GDP per capita is over US$20,000, and the birth rate is over 50 (The exceptions are Israel, Saudi Arabia and Egypt). In addition, education tends to be negatively correlated with birth rates. The higher the standard of education of the adult population (and Japan is one of the highest), the lower the propensity to have children.
Therefore, it must be concluded that it would be unlikely for Japan to increase
births sufficiently to arrest the decline in the total population size.
Ignoring, for the moment, the issue of immigration, the most likely option is the maintenance of the birth rate at its historical level of 40 births per thousand, increasing to 41 over time as the age profile of women aged 15 to 49 gravitates to a younger profile. In 2023, women under 34 accounted for 83% of births in that year. However, they are only 50% of all women aged 15 to 49. However, by 2065, they would increase to 57% of the relevant age group if the birth rate was at 41 per thousand in the earlier years.
What does a sustained birthrate of 40 to 41 per thousand mean for Japan's Demographic and Socioeconomic future?
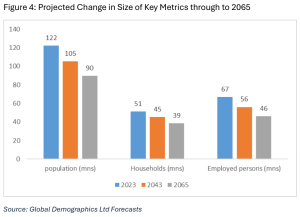
First, it is best to look at what that scenario means for the overall population size and profile. It declines steadily to 92 million by 2065 – compared to 122 million in 2023. A drop of 30 million people. That is substantial. It translates into a projected decline in total households from 51.4 million to 38.7 million, and employed persons (assuming the propensity of working-age persons to be employed stays at its present high level) decline from 66.4 million to 46.3 million.
These are significant reductions, but the reader is reminded that this is taking place over 42 years into the future, so it is quite gradual, and society has time to adjust.
What are the potential implications of this decline in the number of people?
Shape of the Age profile of the population
Given that the currently ‘young’ population will eventually get older, the number of old people will start to decline, and with that, the number of deaths. As such, the difference between births and deaths will decrease. This, in turn, means that the difference between births and deaths is reduced or even reversed, and the overall population profile is more like a square than either a pyramid or an inverted pyramid.
It is worth noting that the number of people over 74 in Japan peaks in 2033. This is very important as demand for health services will start to level out and then reduce, and the total population will start stabilising.
This change in age structure has several other implications:
- The pressure on the social infrastructure is reduced.
- The demand for school places stabilizes and then declines. This means that education spending per student can increase without changing the size of the total education budget. Better quality of education is an advantage for any country, even Japan, where the standard is already high.
- Public transport, roading, etc., will gradually be under less pressure, and the quality can be improved. Again, this is a move from quantity to quality.
- Healthcare has been under significant pressure over the last two decades due to the steady increase in the number of people over 40.
- It is important to note how much the 40-year-old and above population will decline in the future—especially those over 65 and then 75. Japan is one of the first countries to reach what could be ‘peak age. ‘ That is where the 75+ population is declining in number.
- Housing
- The demand for housing will decline, and presumably, with reduced demand, house prices will decline. However, it should be noted that it is a zero-sum game. If the family is selling and buying in the same market, they are no worse off in terms of relative value. They get less for their old home but pay less for their new one. There will be some who end up as valueless, but they are probably not significant in any one year.
- The downside here is that It will impact their share of the equity. The mortgage does not reduce along with the house’s value so that homeowners would suffer some loss in terms of the value of their savings/equity invested in the house.
- The ratio of the Able versus the Dependents
- There seems to be a popular perception that the ratio of persons over 64 to those aged 15 to 64 indicates whether a society can manage. That is a flawed measure. First, it assumes all people over 64 need to be looked after (they don’t). It also ignores the issue that the number of children is generally reducing in number – and children need attention (even if the over 64s don’t). As a result, some commentators claim there is an impending crisis in that there will not be enough people to look after the aged (i.e. those over 64). In the case of Japan, using that argument, the old-to-working-age ratio indeed gets worse – from .5 old to 1 young to 1 old to 1 young.
- However, is that the correct calculation?
- A better measure is the number of people supported by each person at work. That is, the total population minus employed (which gives the number of dependents) is divided by the number of employed persons (irrespective of their age). For Japan, the dependency ratio is 0.83, and is projected to increase to 0.93 by 2065. This is the lowest in the world. Japan does not need migrant support workers.
What about the economy?
The decline in the number of working-age people from 2024 and a consequent decrease in the number of employed people must have economic implications.
The number of employed persons is projected to decline from 67 million in 2024 to 56 million in 2043 and 46 million by 2065. That is a 21% reduction in the size of the physical workforce. This
is calculated using the number of working-age persons multiplied by the 2023 propensity to be employed. However, the propensity to be employed could marginally increase given that reducing the working-age population makes employment easier for the marginal worker).
If productivity per worker did not increase at all, then a similar reduction would happen to the total GDP, but given the workforce is highly educated and skilled in the use of technology,
productivity per worker would likely increase.
In the last decade before 2019 (COVID), productivity per worker in Japan grew at 0.28% per annum. This is low by developed country standards but nonetheless positive. If that is applied forward, productivity per worker will lift from US$75,277 to US$80,274 by 2045 and US$84,657 by 2065. This, in turn, means total GDP would decline by 34% in absolute terms to US$3,850 in 2022 values.
But this is the important point: GDP per capita would increase. From its 2023 levels of US$41,314 to reach US$43,356. In short, fewer people but more affluent
So, while the population reduction will lower the total GDP, it will not lower living standards and potentially increase it. The assumed increase in productivity above is probably conservative as
the reduced workforce sharing the same or more resources may well lift its productivity faster than before.
What does this mean for the household consumer goods market?
That is a function of two factors—the number of households and the income per household. There is also potentially a third factor, which is the age of the householders. Over time, younger
people have a marginally higher propensity to spend than older people. However, this is difficult to quantify, so it is not included in the forecast numbers below.
The combination of a reduced number of households but increased income per household with a propensity to spend held at 80% for the entire period means that total consumer spending in US Dollar real 2022 values would decrease from US$2,710 Bn to US$2,400 in 2045 (CAGR of %) and then to US$2,069 by 2065 (CAGR for 2045 to 65 would be). However, given the increased income per household, it will lift from US$49,060 to US$49,792 by 2065. A growth rate per annum of 0.63% per annum.
To conclude
The reduction of total births, and ultimately the total population, should not necessarily be regarded as a negative scenario. Apart from the potential loss of equity in fixed assets (houses and office space), there seem to be relatively few downsides.
Conversely, a less densely populated country must be more pleasant to live in, especially if access to public services is better. The quality of such services is better (instead of increasing capacity, public funding can improve quality—be it schools, health care, social support, roads, or public transport—without needing to take up more of the GDP.
The movement to a square population means that Japan stabilises at approximately 85 million persons, although improved healthcare (because of longer life expectancy) may increase
that marginally. However, Japan already has one of the longest life expectancies in the world.
Don’t Agree?
Try our Interactive Demographic Model and insert your assumptions about birth rates, propensity to be employed and other relevant variables and assess the implications of those assumptions for Japan.
For more information
Visit globaldemographics.com